Optimization of selective laser sintering molding processing parameters based on CSO-LSSVM model
-
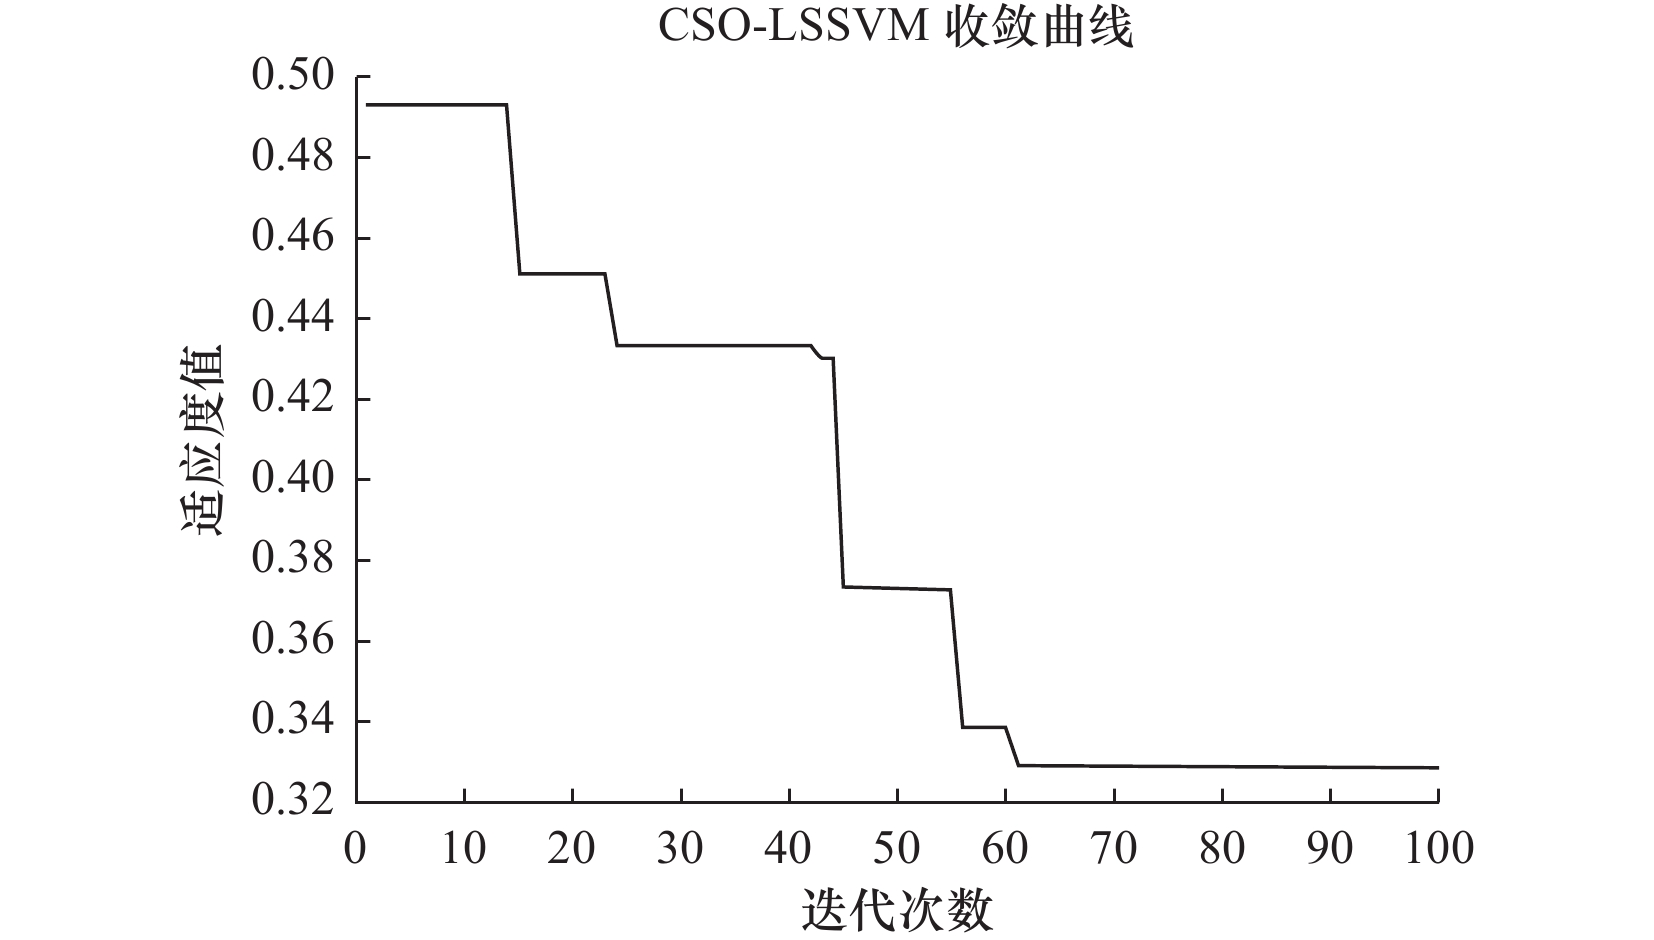
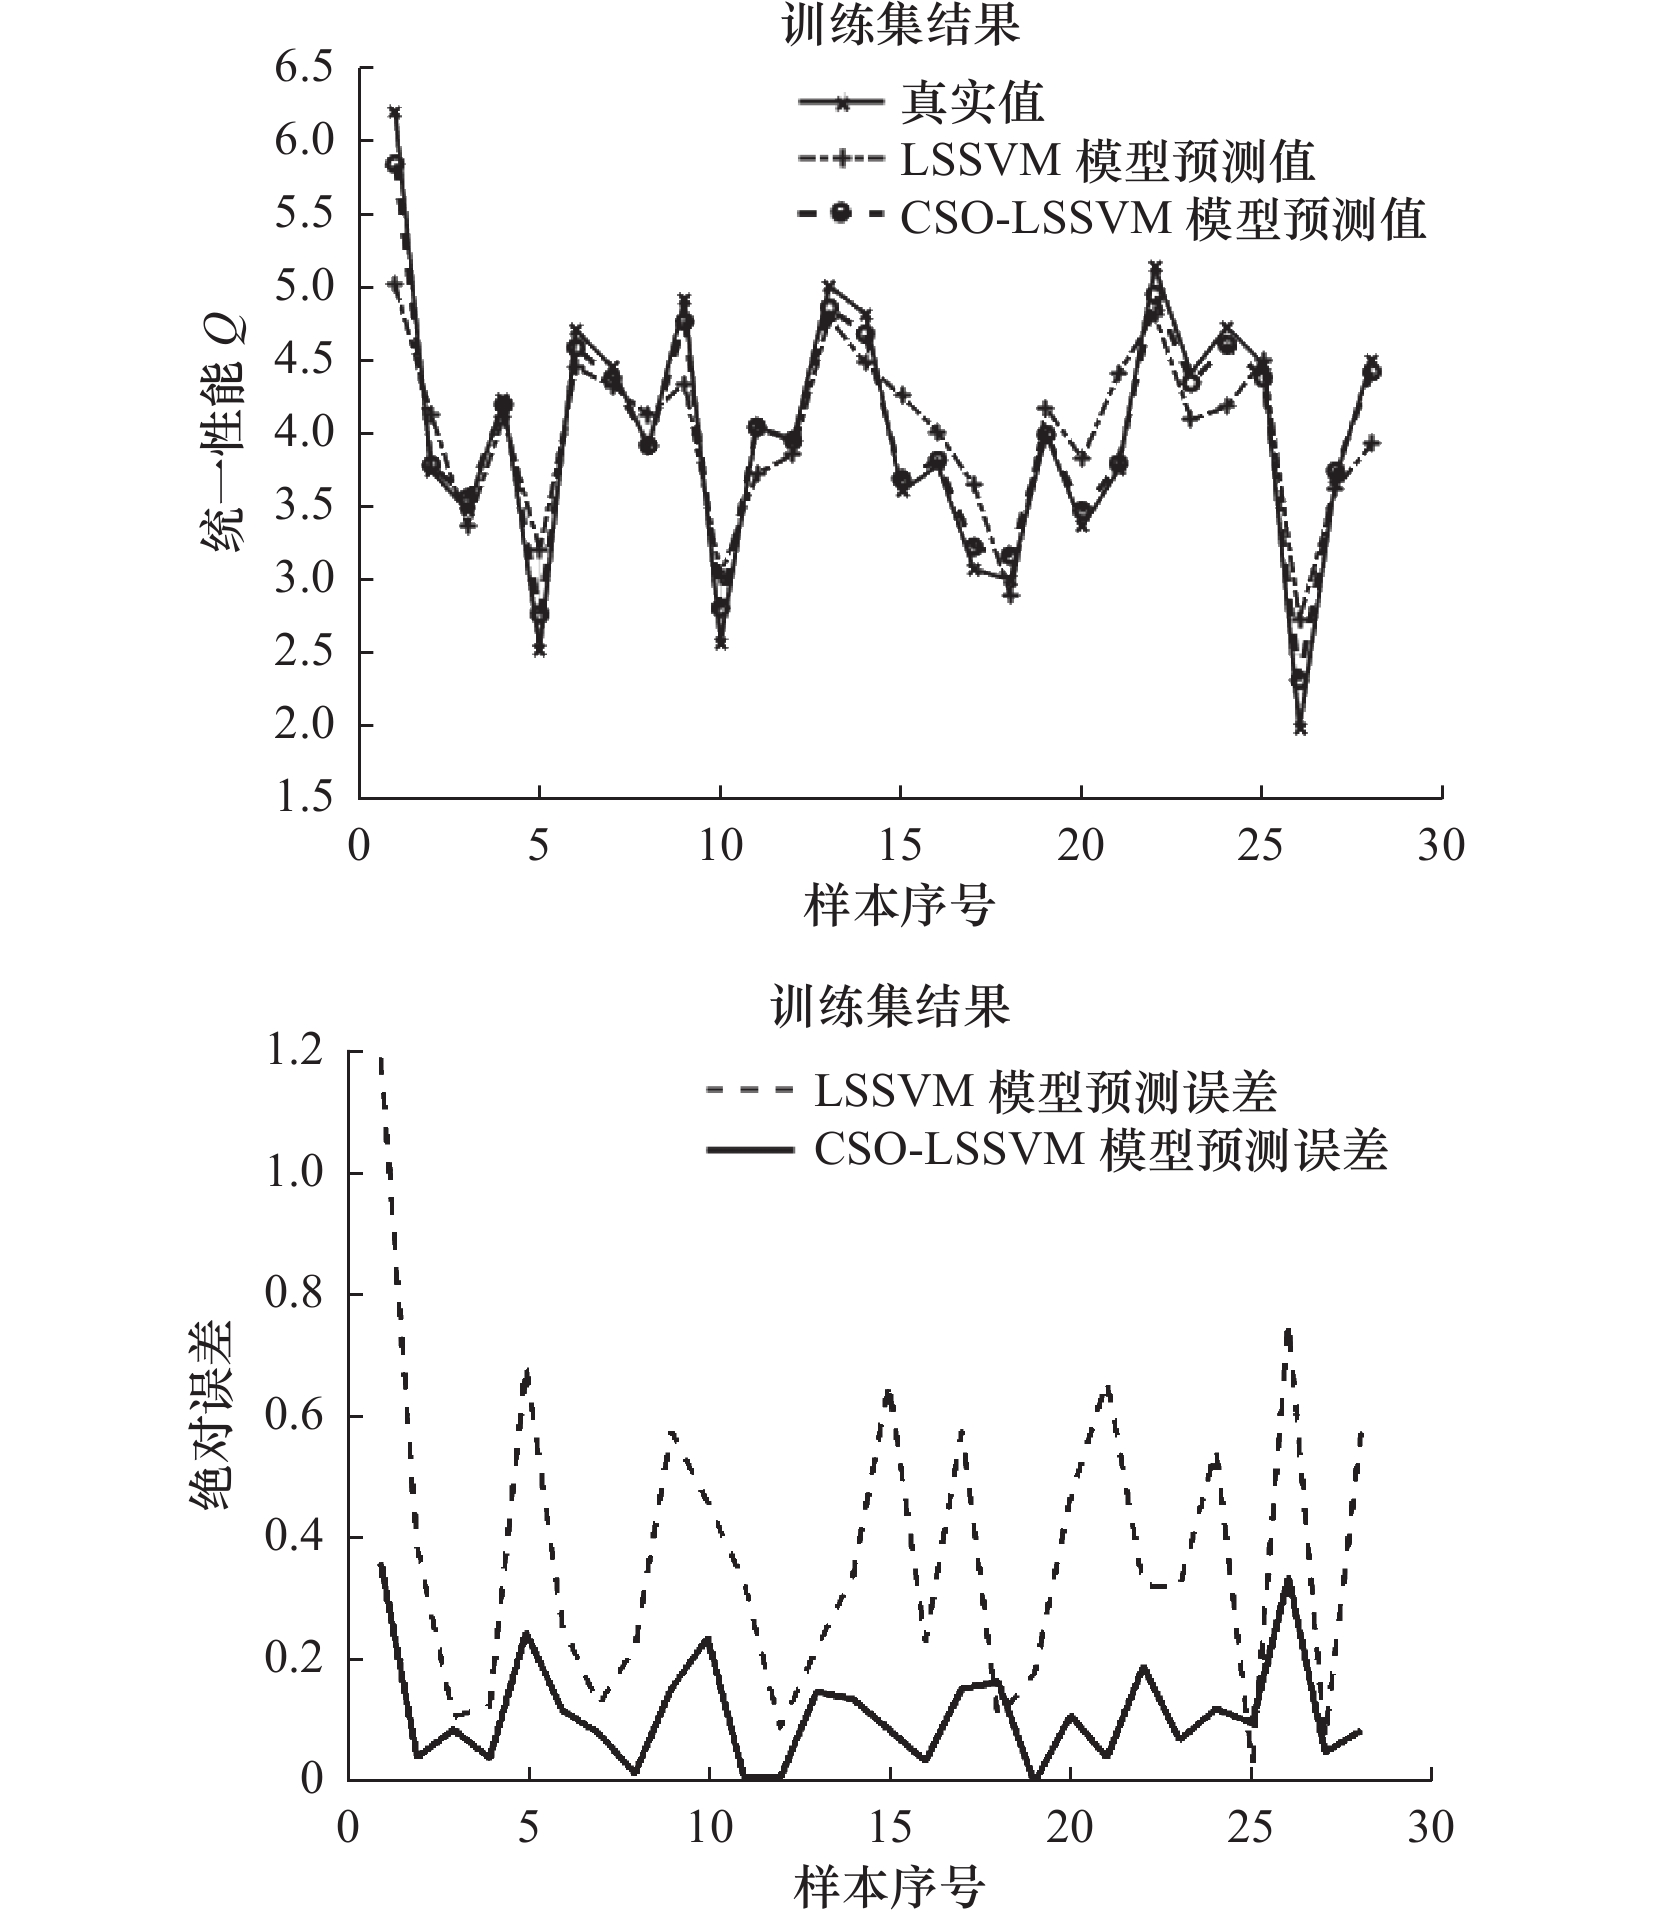
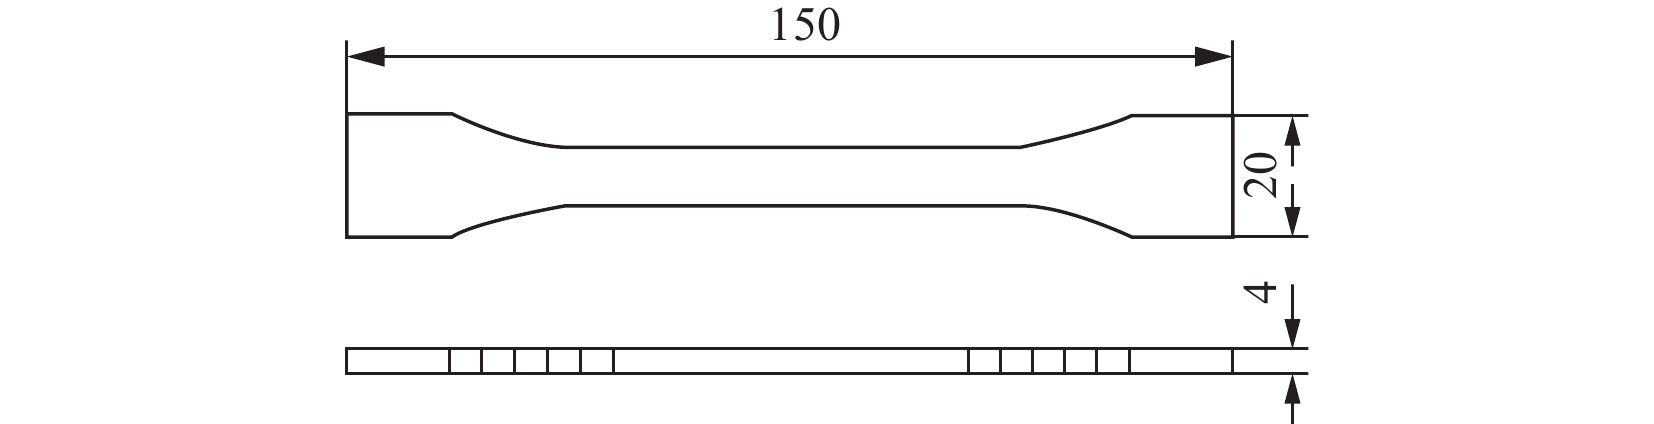
摘要: 成型收缩是影响选择性激光烧结技术(selective laser sintering,SLS)制件精度的关键因素,而工艺参数对材料烧结情况和收缩变形程度有着明显影响,因此选择合理的参数组合对减小精度误差和改善成型性能质量有着重要意义。为降低SLS成型件工艺参数优化试验成本,文章开发了一种名为CSO-LSSVM成型精度预测模型用于工艺参数的预测。该模型的设计思路是:首先,通过Sine映射、非线性切换因子和针孔成像反向学习等3种改进策略全方面协调增强了蛇优化器(snake optimizer,SO)的收敛精度和寻优速度,接着,将改进后的蛇优化器(chaotic multi-strategy enhanced snake optimizer,CSO)与最小二乘支持向量机(least square support vector machine,LSSVM)结合,整定关键核函数参数,提高模型预测精度和泛化能力。为验证CSO-LSSVM模型的有效性和优越性,利用Matlab软件在真实数据集基础上将其与LSSVM、BP(back propagation)神经网络以及极限学习机(extreme learning machine,ELM)模型进行对比。结果表明:文中所提方法具有更高的预测精度,其误差评价指标均方根误差、平均绝对百分比误差和平均绝对误差分别为0.546 2、9.487 7、0.401 7。该模型可为SLS成型加工提供最优工艺参数,有效指导加工。Abstract: Molding shrinkage significantly impacts the precision of selective laser sintering (SLS) components, with process parameters playing a critical role in material sintering and shrinkage deformation. Enhancing molding performance quality holds paramount importance. To curtail testing costs in the optimization of process parameters for SLS-molded parts, we introduce the CSO-LSSVM molding accuracy prediction model. The model’s design rationale is multifaceted: first, we comprehensively enhance the convergence accuracy and optimization speed of the snake optimizer (SO) through a trio of improvement strategies—Sine mapping, nonlinear switching factors, and pinhole imaging reverse learning. Subsequently, we seamlessly integrate the termed chaotic multi-strategy enhanced snake optimizer (CSO) with the least square support vector machine (LSSVM) to fine-tune pivotal kernel function parameters, thereby augmenting predictive accuracy and generalization capabilities. To affirm the validity and superiority of the CSO-LSSVM model, we leverage Matlab software for comparative analysis against LSSVM, BP (back propagation) neural network, and extreme learning machine (ELM) models using authentic datasets. Results unequivocally establish the method's heightened predictive accuracy, substantiated by error evaluation metrics: root mean square error of 0.546 2, mean absolute percentage error of 9.487 7, and mean absolute error of 0.401 7, respectively. This model facilitates the provisioning of optimal process parameters for SLS molding, thereby offering effective processing guidance.
-
表 1 正交试验因素水平
水平 1 2 3 4 5 激光功率P/W 8 10 12 14 16 预热温度T/℃ 76 78 80 82 84 扫描速度V/(mm/s) 1 600 1 800 2 000 2 200 2 400 扫描间距L/mm 0.12 0.14 0.16 0.18 0.20 分层厚度D/mm 0.12 0.14 0.16 0.18 0.20  下载: 导出CSV
表 2 试验样本数据结果
实验
序号工艺参数 试验结果 P/
WT/
℃V/
(mm/s)L/
mmD/
mm$ {\varepsilon }_{x} $/
(%)$ {\varepsilon }_{y} $/
(%)$ {\varepsilon }_{{\textit{z}}} $/
(%)Q 1 8 76 1 600 0.12 0.12 1.57 8.10 3.75 4.82 2 8 78 2 000 0.18 0.20 1.71 8.00 3.00 5.14 3 8 80 2 400 0.14 0.18 1.49 9.95 9.00 5.01 4 8 82 1 800 0.20 0.16 1.11 7.45 7.00 3.75 5 8 84 2 200 0.16 0.14 1.19 6.65 4.50 3.79 6 8 80 2 000 0.12 0.16 1.44 6.40 5.50 4.48 7 8 82 2 200 0.14 0.18 1.86 13.30 9.00 6.20 8 10 76 2 400 0.18 0.16 0.69 6.85 5.50 2.53 9 10 78 1 800 0.14 0.14 1.25 8.10 2.75 3.94 10 10 80 2 200 0.20 0.12 0.80 5.75 2.25 2.58 11 10 82 1 600 0.16 0.20 1.38 8.15 3.00 4.29 12 10 84 2 000 0.12 0.18 1.18 5.85 5.50 3.76 13 10 80 2 000 0.12 0.16 1.19 5.50 2.50 3.61 14 10 84 2 400 0.16 0.20 1.03 7.80 2.25 3.30 15 12 76 2 200 0.14 0.20 1.24 7.70 3.25 3.91 16 12 78 1 600 0.20 0.18 1.59 10.10 7.00 5.17 17 12 80 2 000 0.16 0.16 1.43 8.75 8.00 4.73 18 12 82 2 400 0.12 0.14 1.27 7.75 6.50 4.16 19 12 84 1 800 0.18 0.12 1.52 5.45 3.25 4.51 20 12 78 1 800 0.18 0.14 1.47 7.15 2.00 4.42 21 12 82 2 200 0.16 0.18 1.30 10.45 7.25 4.46 22 14 76 2 000 0.20 0.14 1.21 7.30 8.00 4.06 23 14 78 2 400 0.16 0.12 0.97 7.00 0.50 3.01 24 14 80 1 800 0.12 0.20 1.53 7.90 3.50 4.71 25 14 82 2 200 0.18 0.18 1.11 5.70 1.75 3.37 26 14 84 1 600 0.14 0.16 1.67 5.85 3.25 4.92 27 14 76 1 600 0.14 0.16 1.33 7.45 1.00 4.00 28 14 82 2 400 0.12 0.18 1.27 8.50 8.00 4.31 29 16 76 1 800 0.16 0.18 1.34 7.20 5.00 4.24 30 16 78 2 200 0.12 0.16 1.15 5.45 2.00 3.48 31 16 80 1 600 0.18 0.14 1.03 5.50 0.75 3.08 32 16 82 2 000 0.14 0.12 0.63 5.20 0.50 1.99 33 16 84 2 400 0.20 0.20 1.21 6.20 2.75 3.70 34 16 78 1 800 0.20 0.16 1.23 7.35 5.00 3.95 35 16 84 2 000 0.16 0.12 1.27 6.45 0.50 3.77
下载: 导出CSV
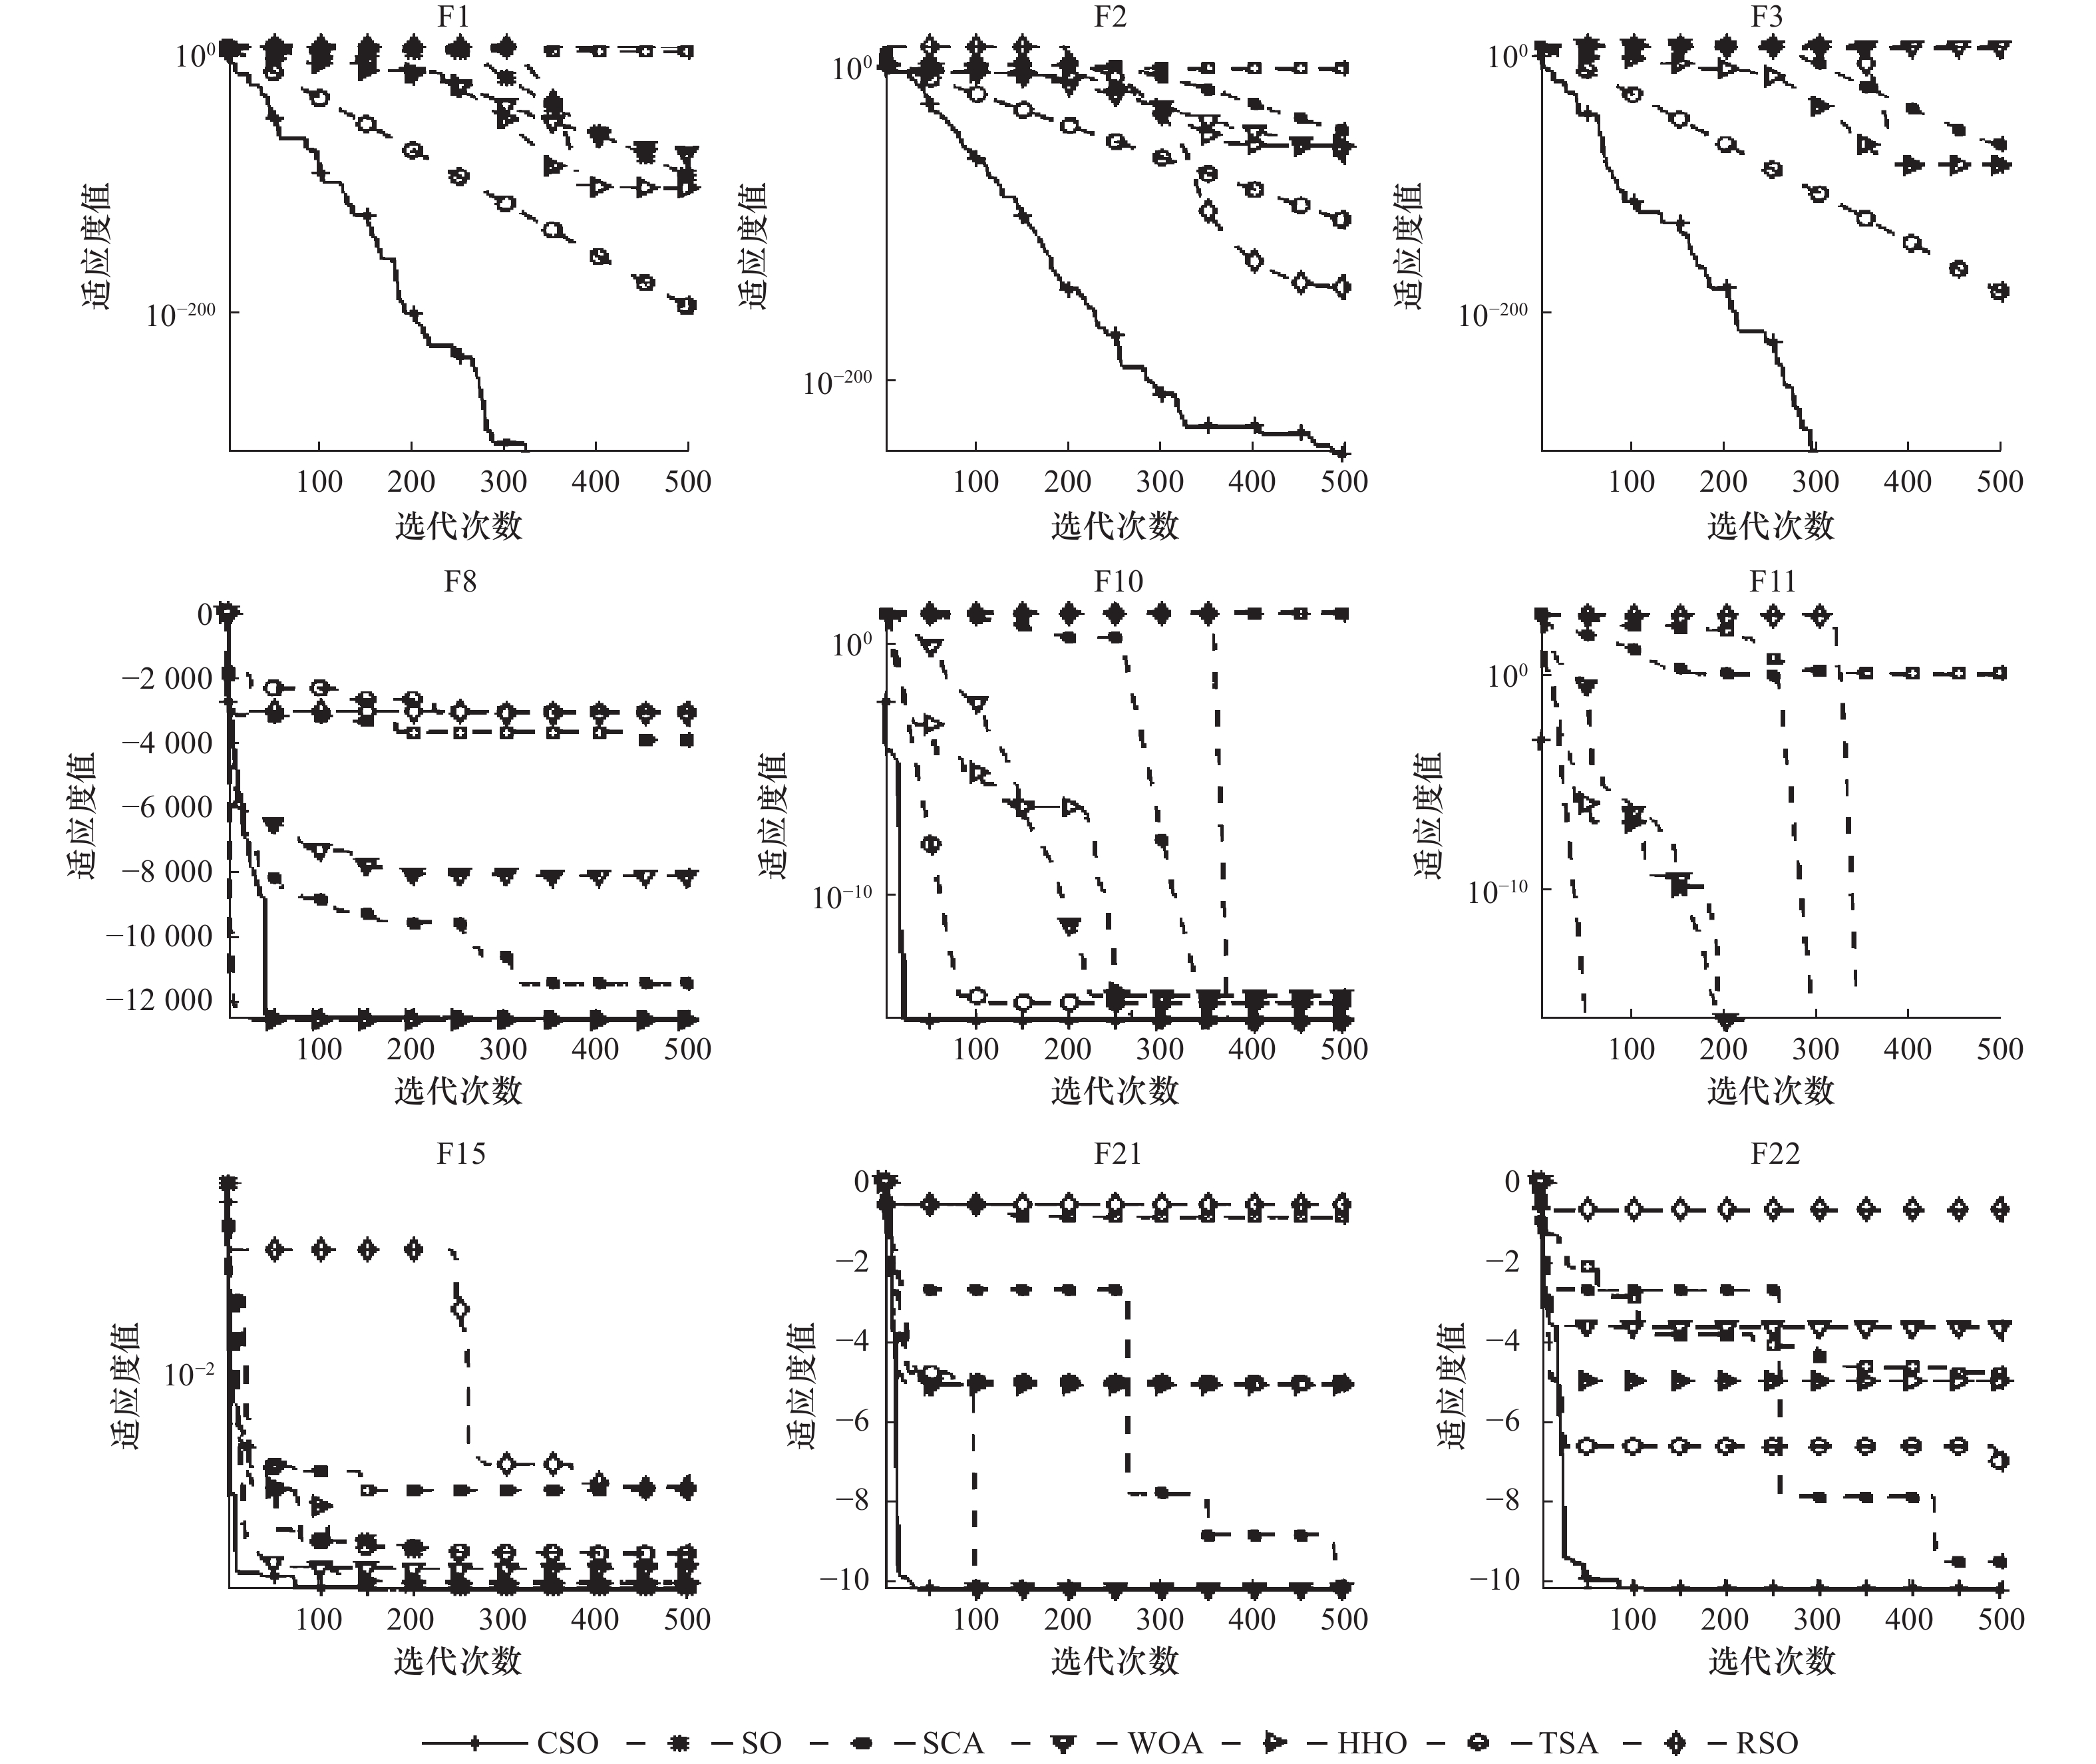
表 3 不同对比算法在部分基准测试函数上的优化结果
函数(最优值) 评价指标 SO WOA HHO SCA RSO TSA CSO F1(0) Avg 3.13×10−94 1.38×10−73 2.44×10−97 1.37×10+01 1.92×10−260 1.94×10−194 1.46×10−273 Std 1.03×10−93 4.86×10−73 1.09×10−96 3.96×10+01 0.00×10+00 0.00×10+00 0.00×10+00 F3(0) Avg 7.32×10−57 4.35×10+04 1.17×10−75 8.75×10+03 5.56×10−272 1.10×10−181 9.22×10−317 Std 2.30×10−56 1.45×10+04 6.40×10−75 4.79×10+03 0.00×10+00 0.00×10+00 0.00×10+00 F5(0) Avg 2.68×10+01 2.79×10+01 1.29×10−02 9.43×10+04 2.89×10+01 2.86×10+01 4.04×10⁻¹² Std 2.70×10+01 5.15×10−01 2.41×10−02 2.96×10+05 1.69×10−01 3.42×10−01 2.21×10⁻¹¹ F9(0) Avg 1.73×10+00 1.89×10⁻¹⁵ 0.00×10+00 4.06×10+01 0.00×10+00 1.13×10+01 0.00×10+00 Std 6.14×10+00 1.04×10⁻¹⁴ 0.00×10+00 3.81×10+01 0.00×10+00 2.99×10+01 0.00×10+00 F10(0) Avg 1.79×10−01 4.68×10⁻¹⁵ 8.88×10⁻¹⁶ 1.39×10+01 1.01×10⁻¹⁵ 4.56×10⁻¹⁵ 8.88×10⁻¹⁶ Std 6.83×10−01 2.63×10⁻¹⁵ 0.00×10+00 8.92×10+00 6.49×10⁻¹⁶ 6.49×10⁻¹⁶ 0.00×10+00 F13(0) Avg 3.93×10−01 6.10×10−01 9.31×10−05 3.53×10+05 2.92×10+00 2.58×10+00 2.97×10⁻¹⁷ Std 6.49×10−01 2.76×10−01 1.04×10−04 1.24×10+06 2.12×10−01 2.98×10−01 1.61×10⁻¹⁶ F15(0.0003) Avg 4.40×10−04 5.89×10−04 4.07×10−04 1.12×10−03 1.76×10−03 1.04×10−02 3.21×10−04 Std 1.38×10−04 3.10×10−04 2.62×10−04 3.65×10−04 3.54×10−03 2.11×10−02 7.56×10−05 F21(-10.1532) Avg −10.138 5 −8.357 8 −5.519 2 −2.628 6 −0.607 7 −7.246 1 −10.152 2 Std 5.90×10−02 2.43×10+00 1.42×10+00 1.95×10+00 2.67×10−01 1.58×10+00 5.68×10−03 F22(−10.4028) Avg −10.402 6 −7.842 4 −5.256 3 −3.017 7 −1.336 0 −6.202 6 −10.402 9 Std 2.03×10−03 3.02×10+00 9.53×10−01 1.81×10+00 9.19×10−01 2.43×10+00 3.71×10−06
下载: 导出CSV
表 4 不同模型在测试集的预测值与真实值对比结果
实验
序号真实值 LSSVM
模型BP神经
网络ELM
模型CSO-LSSVM
模型9 3.94 4.35 5.02 4.25 4.00 11 4.29 4.97 4.78 5.39 4.00 14 3.30 4.70 4.96 4.52 4.00 16 5.17 4.44 5.68 3.55 4.00 18 4.16 3.32 3.40 2.29 4.00 28 4.31 3.76 3.48 3.26 4.00 35 3.77 2.99 2.26 2.37 3.89
下载: 导出CSV
表 5 不同模型的性能评估对比结果
类型 评价
指标LSSVM
模型BP神经
网络ELM
模型CSO-LSSVM
模型测试集 RMSE 0.822 9 1.066 5 1.306 1 0.546 2 MAPE/(%) 19.487 0 25.214 0 29.702 0 9.487 7 MAE 0.769 7 0.976 7 1.222 4 0.401 7
下载: 导出CSV
-
[1] Shirazi S F S,Gharehkhani S,Mehrali M,et al. A review on powder-based additive manufacturing for tissue engineering:selective laser sintering and inkjet 3D printing[J]. Science and Technology of Advanced Materials,2015,16(3):033502. doi: 10.1088/1468-6996/16/3/033502 [2] 杨来侠,桂玉莲,李素丽,等. 信噪比与灰色关联分析选区激光烧结成型工艺的研究[J]. 塑料工业,2020,48(1):78-81,86. doi: 10.3969/j.issn.1005-5770.2020.01.017 [3] 张瀚,蒋国璋,段现银. 选择性激光烧结3D打印参数对成型精度影响研究[J]. 现代制造工程,2019(5):77-82. doi: 10.16731/j.cnki.1671-3133.2019.05.014 [4] 李小飞,董俊慧,张永志. 基于模糊RBF神经网络的选域激光烧结尺寸精度预测建模[J]. 铸造,2008(10):1029-1032. [5] 刘兆平,王宏松,修辉平. 基于BP神经网络的覆膜砂选择性激光烧结件精度预测[J]. 热加工工艺,2016,45(21):91-93. doi: 10.14158/j.cnki.1001-3814.2016.21.024 [6] 肖亚宁,郭艳玲,张亚鹏,等. 基于SOA-BP神经网络的SLS成型件精度预测模型[J]. 科学技术与工程,2021,21(23):9864-9870. doi: 10.3969/j.issn.1671-1815.2021.23.027 [7] Zhang Y P,Guo Y L,Xiao Y N,et al. A novel hybrid improved hunger games search optimizer with extreme learning machine for predicting shrinkage of SLS parts[J]. Journal of Intelligent & Fuzzy Systems,2022,43:1-17. [8] Ji L B,Zhou T R,Zhong X H. Multi-objective optimization of fused deposition modeling based on neural network and genetic algorithm[J]. Hot Working Technology,2010,39(9):174-177. [9] Suykens J,Vandewalle J. Least squares support vector machine classifiers[J]. Neural Processing Letters,1999,9:293-300. doi: 10.1023/A:1018628609742 [10] 肖亚宁,孙雪,张亚鹏,等. 基于SOA-LSSVM的SLS成形工艺参数优化研究[J]. 机床与液压. 2022,50 (6):36-42. [11] Zhu X,Ma S Q,Xu Q,et al. A WD-GA-LSSVM model for rainfall-triggered landslide displacement prediction[J]. Journal of Mountain Science,2018,15:156-166. doi: 10.1007/s11629-016-4245-3 [12] Hashim F A,Hussien A G. Snake optimizer:a novel meta-heuristic optimization algorithm[J]. Knowledge-Based Systems,2022,242:108320. doi: 10.1016/j.knosys.2022.108320 [13] Wang Y W,Xiao Y N,Guo Y L,et al. Dynamic chaotic opposition-based learning-driven hybrid aquila optimizer and artificial rabbits optimization algorithm:framework and applications[J]. Processes,2022,10:2703. doi: 10.3390/pr10122703 [14] Wang L Y,Cao Q J,Zhang Z X,et al. Artificial rabbits optimization:a new bio-inspired meta-heuristic algorithm for solving engineering optimization problems[J]. Engineering Applications of Artificial Intelligence,2022,114:105082. doi: 10.1016/j.engappai.2022.105082 [15] Long W,Jiao J J,Liang X M,et al. Pinhole-imaging-based learning butterfly optimization algorithm for global optimization and feature selection[J]. Applied Soft Computing,2021,103:107146. doi: 10.1016/j.asoc.2021.107146 [16] Mirjalili S,Lewis A. The whale optimization algorithm[J]. Advances in Engineering Software,2016,95:51-67. doi: 10.1016/j.advengsoft.2016.01.008 [17] Heidari A A,Mirjalili S,Faris H,et al. Harris hawks optimization:algorithm and applications[J]. Future Generation Computer Systems,2019,97:849-872. doi: 10.1016/j.future.2019.02.028 [18] Mirjalili S. SCA:A sine cosine algorithm for solving optimization problems[J]. Knowledge-Based Systems,2016,96:120-133. doi: 10.1016/j.knosys.2015.12.022 [19] Dhiman G,Garg M,Nagar A,et al. A novel algorithm for global optimization:rat swarm optimizer[J]. Journal of Ambient Intelligence and Humanized Computing,2021,12(8):8457-8482. doi: 10.1007/s12652-020-02580-0 [20] Kaur S,Awasthi L K,Sangal A L,et al. Tunicate swarm algorithm:A new bio-inspired based metaheuristic paradigm for global optimization[J]. Engineering Applications of Artificial Intelligence,2020,90:103541. doi: 10.1016/j.engappai.2020.103541 [21] Shahin M A,Maier H R,Jaksa M B. Data division for developing neural networks applied to geotechnical engineering[J]. Journal of Computing in Civil Engineering,2004,18(2):105-114. doi: 10.1061/(ASCE)0887-3801(2004)18:2(105) -

 下载:
下载:


 点击查看大图
图(6) / 表(5)
计量
- 文章访问数: 43
- HTML全文浏览量: 16
- PDF下载量: 18
- 被引次数: 0